| Double Top | Double Bottom | Triple Top | Triple Bottom |
| Triangle | Head and Shoulder | Flag and Penant | Channel |
| Cup And Handle | Support By Daily Trendline |
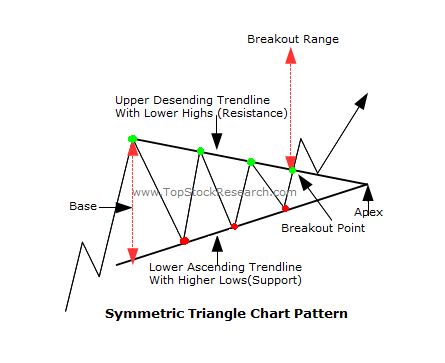
Symmetric Triangles is an another types of triangle chart pattern used by traders. Again like ascending and descending triangle it takes few weeks to few months for this type of pattern to formed. It is also a and it is a continuation pattern of high reliability giving bearish signal in a Downtrend Basics and bullish in an Uptrend Basics. This pattern also consist of four parts:
1. Lower Ascending trend-line: It forms the support and generally have at-least two points, more the better.
2. Upper Descending (falling) trend-line: It forms the resistance in the pattern and have at-least two points, more the better.
3. Base: It is the vertical line drawn between lower trend-line, at which the pattern started to the trend-line opposite to it. The value of base is used to keep the minimum target amount.

4. Apex: It is the point where lower Ascending line and upper Descending line meets. Some traders used apex as the time in which the minimum targets is achieved.
This Trends Basics is formed when there is a good completion between Buyers and sellers, no body is giving up as a result there is formation of lower highs and higher lows. Price continues to move in the direction of the trend. Like other Triangle pattern the breakout is seen before the apex is reached, almost after 2/3 length of the pattern is formed.
With this pattern formation there is a reduction in the Volume, and at the breakout point there is an increase in the volume. Therefore one have to pay attention to the volume movement for further confirmation.
Again integrating this pattern with other technical indicators maximize the profit and increase the confidence in placing yourself at the right position of the market. Similarly one can incorporate studies of MACD, Bollinger etc., to further enhance the pattern reliability and finally the profit.
Our website provides free Stock screening based on Triangle Pattern for Indian Stocks. It can be found at:
