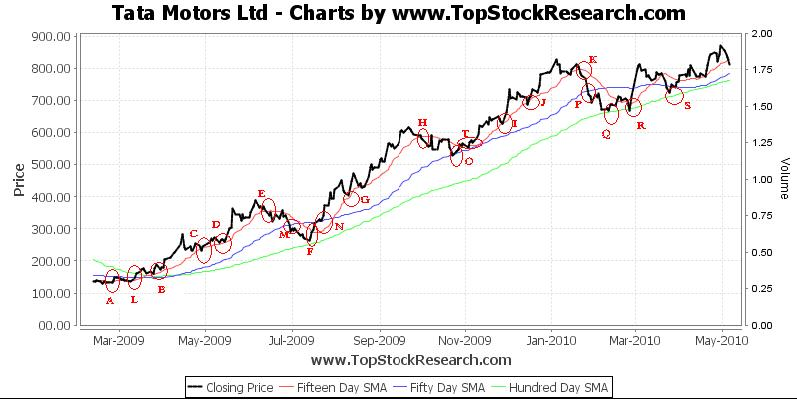
Technicals Stability Returns


Related Tutorial On Technical Analysis
Most Volatile Share Rate of Change (ROC) Beta Stocks Chaikin Money Flow (CMF)
Average Directional Index (ADX) Accumulation Distribution Index (ADI) On Balance Volume (OBV) Bollinger Band
MACD Volume Pivot Point Moving Average basics
Moving Average basicsCalculate Moving AverageWhen to avoid MA

Strategies Involved When Trading With Moving Averages


Example of Trading With Price Verses Moving Averages: Tata Motors Ltd

The chart below is of Tata Motors for a period starting from March 2009 to May 2010.The chart shows price along with 15 day moving average(MA), 50 day moving average(MA) and 100 day moving average(MA).

For better understanding we have made certain points at crossover helping us to understand, when is good signal for buy or sell.

Example of trading with price verses Moving Averages Case Study Tata Motors strategies involved when trading with moving averages

Traders investing on stocks with 15 day Moving Average will find trends on chart of Tata Motors.

1. First occasion
  • At point A (price around 135) price line makes crossover giving a buy signal.
  • 15 day moving average further supports the price line at points B, C and D .
  • At point E(price around 340) it breaches MA giving a sell signal.
  • Profit is around 150% .
  • Gain is 205 Rs(from 135Rs to 340Rs).
  • Time Period from mid march 09 to July start 09.
2. Second occasion
  • Price line crossover near point F with price around 290 a buy signal is generated.
  • Support to price line at point G .
  • A sell signal is generated at point H (price around 590).
  • Profit is more than 100%.
  • Gain is 300 Rs(from 290Rs to 590Rs).
  • Time period from August 09 end to October 09 end.
3. Third occasion
  • In November 2009 at point T when price is at 560 a crossover gives buy signal .
  • Supports at points I and J .
  • An exit signal at breach at point K(price around 800) giving a pretty good profit.
  • Profit is about 42 %.
  • Gain is 240 Rs(from 560Rs to 800Rs).
  • Time period from start of November 09 to end of February 2010.

Traders investing on stocks with 50 day moving average will find trends on chart of Tata Motors.

1. First occasion
  • At point L(price around 150) in the month of march 09 a buy signal is generated.
  • At point M(price around 310) a sell signal is generated.
  • Profit is more than 100%.
  • Gain is 160Rs(from 150Rs to 310Rs).
  • Time period March 09 start to july 09 end.
2. Second occasion
  • At point N (price around 325) in month of august 2009 a buy signal is generated.
  • At point O gets a support.
  • A sell signal is generated at breach at point P(price is 730).
  • Profit is around 125%.
  • Gain is 405Rs(from 325Rs to 730Rs).
  • Time period August 09 end to Feb end 2010.

Traders investing on stocks with 100 day moving average will find trends on chart of Tata Motors.

1. First occasion
  • At point L(price around 150) in the month of march a buy signal is indicated.
  • Supports at point F in month of July,at points Q and R in month of February 2010 and also at point S gives a support.
  • Profit is more than 400%.
  • Gain is 650Rs(800Rs-150Rs).
  • Time Period is about 15 Months(march 09 to May 10).

Moving Average Screeners
Simple Moving Average (SMA)
Weighted Moving Average (WMA)
Exponential Moving Average (EMA)

Go to the Top


Wait for US Stock Analytics & Screeners is Over
StockAio.com (Stock All In One) is now Live
We hope you will provide us with the same Love & Support as you did for TSR.
Wait for US Stock Analytics is Over
StockAio.com (Stock All In One) is now Live
We hope you will provide us with the same Love & Support as you did for TSR.